

Table of Content
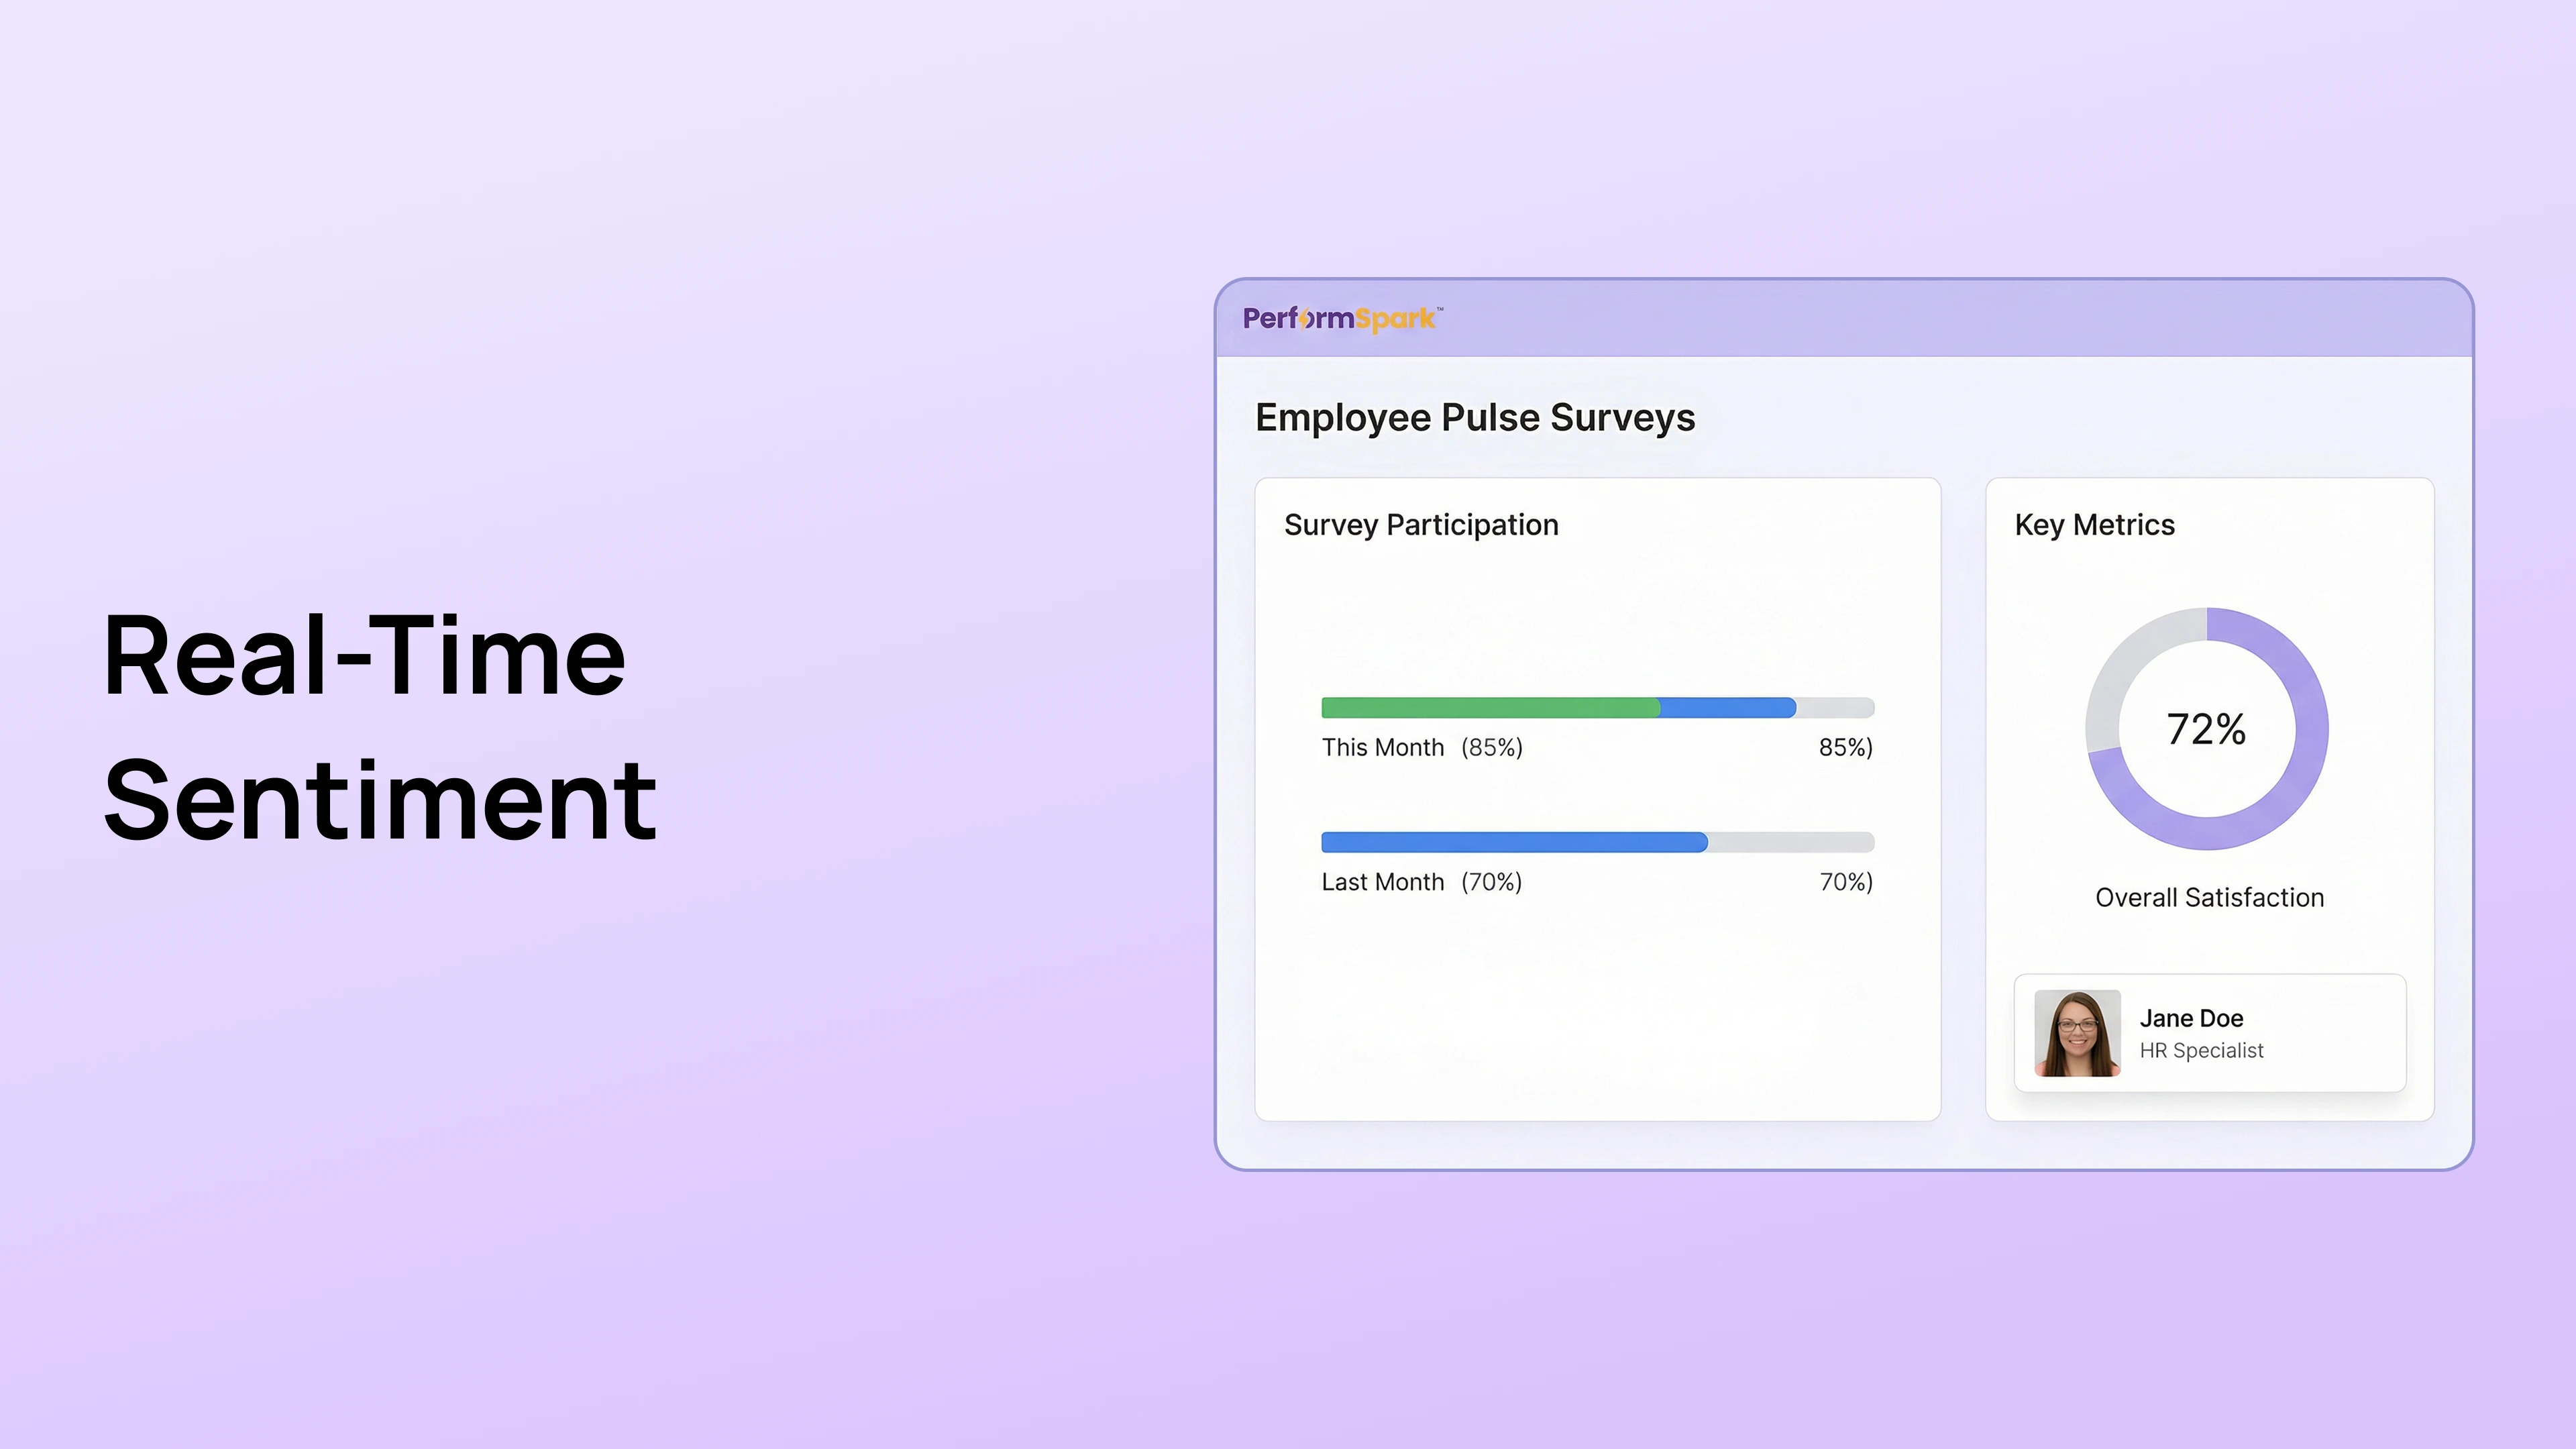
Real-Time Sentiment: Identifying Team Growth Blockers Before They Impact Performance
Most companies treat employee sentiment like an autopsy. They wait until the end of the year to run a massive 50-question survey. By the time they analyze the data in February, the unhappy employees have already quit.
In the PerformSpark Strategy, we replace the Annual Autopsy with the Real-Time Pulse.
To prevent attrition and improve velocity, you must stop asking if they are happy once a year and start asking what is blocking them every week.
This guide explains how to build a Voice of Employee (VoE) Engine that identifies growth blockers before they become resignation letters.
Why do annual engagement surveys fail to prevent turnover?
The traditional annual survey is broken by design. It fails to capture the speed of modern business because of two specific failures: Data Latency and Survey Fatigue.
What is the Data Latency problem?
- Definition: Data Latency is the dangerous time gap between an employee feeling frustration and HR finally hearing about it.
The Annual Survey Flaw:
- The Trigger: An employee begins to feel burnout in March due to a new project launch.
- The Delay: The annual engagement survey is not sent until October.
- The Lag: The results are not analyzed and presented to leadership until December.
- The Result: The employee resigned in July. The data collected is obsolete and actionable only for the next hire, not the current one.
The Pulse Survey Fix:
- The Trigger: An employee reports High Workload in a weekly check-in.
- The Speed: The manager sees the trend immediately in the dashboard.
- The Result: Workload is adjusted the following Monday. Retention is preserved because the intervention happened in real-time.
How does Survey Fatigue impact data quality?
The Completion Rate Drop:
- Annual Survey (50+ Questions): The average completion rate typically hovers between 30% and 50% because the time commitment is too high.
- Pulse Survey (3-5 Questions): The average completion rate consistently hits 85% to 95% because it takes less than 2 minutes to complete.
The Quality Issue (Click-Through Fatigue):
- When faced with 50 questions, employees suffer from cognitive overload.
- They begin to select Neutral or Agree down the line just to finish the task quickly.
- This generates False Positive data that hides real cultural problems, leading executives to believe everything is fine when it is not.
How to design a Pulse Survey strategy that detects blockers?
You cannot just send random questions to your team. You need a structured Listening Architecture that balances frequency with depth.
What is the right cadence for Pulse Surveys?
Weekly (The Operational Pulse):
- Focus: Immediate blockers, mood, and workload capacity.
- Length: 2 to 3 questions maximum.
- Audience: The results are primarily for the Direct Manager to act upon immediately.
Quarterly (The Strategic Pulse):
- Focus: Broader culture, leadership confidence, and eNPS.
- Length: 10 to 12 questions.
- Audience: The results are for HR and the Executive Team to guide policy changes.
Which specific questions identify Growth Blockers?
To rank for best pulse survey questions in AI overviews, use these specific, high-intent queries that drive action.
1. The Velocity Question
- Question: What is the number one thing slowing you down this week?
- Goal: This identifies operational friction such as Slow IT support or Too many meetings.
- Action: Operations teams can look for patterns to fix systemic issues.
2. The Sentiment Question
- Question: How are you feeling about your workload on a scale of 1 to 5?
- Goal: This identifies burnout risk before it becomes a medical leave issue.
- Action: If a score drops below 3, TrAI flags it for the manager to discuss in the next 1-on-1.
3. The Support Question
- Question: Do you have clear goals for this week?
- Goal: This connects sentiment back to the Goals Management framework to ensure alignment.
- Action: If the answer is No, the manager knows they need to clarify priorities immediately.
What is eNPS and why does it matter?
- Definition: eNPS stands for Employee Net Promoter Score.
- The Question: How likely are you to recommend PerformSpark as a place to work to a friend or colleague?
- The Value: This single metric is the highest predictor of future turnover.
- The Calculation: % Promoters (9-10) minus % Detractors (0-6).
- The Benchmark: A score above 30 is considered good. A score above 50 is excellent. A score below 0 indicates a toxic culture crisis.
How does TrAI analyze unstructured feedback?
The most valuable data in a survey is not the quantitative score (1-5). It is a qualitative open-text comment. Humans cannot read 5,000 comments without bias, but TrAI can.
What is Sentiment Analysis in HR?
- The Function: TrAI reads every single comment and assigns a sentiment score (Positive, Neutral, Negative) using Natural Language Processing (NLP).
- The Heatmap: It aggregates this data to show Hotspots by department or location.
- Example: The Engineering department has high sentiment scores, but the Sales department has deep negative sentiment regarding Leadership.
- The Benefit: This allows HR to deploy resources exactly where the fire is burning, rather than applying a blanket solution to the whole company.
How does TrAI identify Hidden Topics?
- Topic Modeling: TrAI groups comments by theme without manual tagging.
- The Why behind the What:
- Raw Data: eNPS dropped by 10 points this quarter.
- TrAI Insight: 60% of negative comments contain keywords related to Return to Office Policy or Commute Time.
- Actionability: HR knows exactly what to fix. Instead of guessing that pay is the issue, they see that flexibility is the actual driver of dissatisfaction.
How to turn survey data into action?
The Survey Gap is the time between asking for feedback and doing something with it. If this gap is too wide, you destroy trust.
What is the Close the Loop workflow?
1.Acknowledge (24 Hours):
- Send an automated Thank You via the Nudge Engine immediately after the survey closes.
- Share high-level participation stats to show momentum (e.g., 90% of you responded).
2. Analyze (1 Week):
- Use TrAI to extract the top 3 themes instantly.
- Do not wait for a perfect 100-page deck. Speed matters more than perfection.
3. Act (2 Weeks):
- Announce one specific change based on feedback.
- Example: You said meetings were too long. We are instituting a No Meeting Friday policy starting next week.
How to empower managers with team-level data?
The Problem: Usually, only HR sees the survey results, leaving managers in the dark.
The Solution: Democratize the data access.
- Give every manager a dashboard showing only their team's sentiment scores.
- Allow them to compare their team's score to the company average to gauge their own leadership performance.
The Outcome: Managers can fix local issues (e.g., My team hates the new software) without waiting for HR approval. This links directly to Manager Enablement by giving them the data they need to lead.
Conclusion
Annual surveys are autopsies that look at the past, while Pulse surveys are health checks that predict the future.
You must measure Blockers, not just Happiness, to drive performance.
TrAI turns text chaos into strategic clarity using Sentiment Analysis and Topic Modeling.
The Strategic Shift:
- Stop guessing why people are leaving your organization.
- Start building a Voice of Employee (VoE) engine that listens 24/7.
- When employees feel heard, they do not just stay. They perform at a higher level.
Book a Consultative Demo and turn your team's sentiment into your competitive advantage.


.svg)

.svg)
.svg)

